

Example Blog Article
Example Blog Article
rearc
ai
llm
Agents fail without throwing errors. Here's how to test them the way we test code, with MLflow tracing, scorers, the Prompt Registry, production monitoring and Unity Gateway on Databricks.
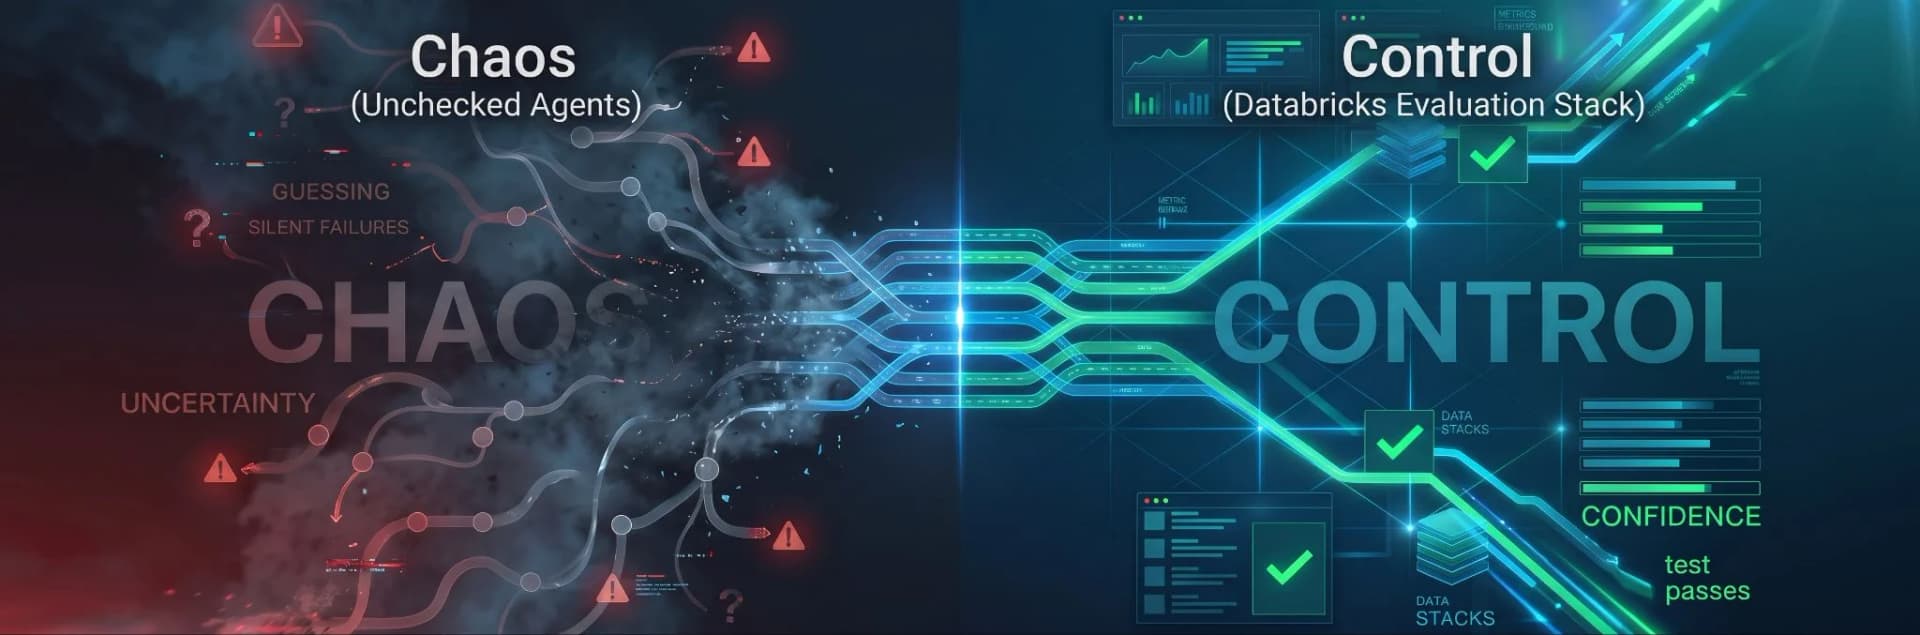
In April 2025, users of the AI code editor Cursor kept getting logged out when they switched machines. Support emails came back from "Sam", who explained that this was expected behavior under a new login policy. There was no such policy. Sam was an AI bot, and reports of cancelled subscriptions spread before a cofounder apologized on Reddit for an "incorrect response from a front-line AI support bot."
Nothing crashed and no alert fired. The bot returned a fluent, confident, wrong answer, which is how agents usually fail. Most teams can watch that happen but can't catch it. In LangChain's survey of 1,340 practitioners, 89% had observability on their agents, but only 52% ran offline evaluations and 37% evaluated live traffic.
We solved this problem for regular code a long time ago with test-driven development (TDD). AI evaluation is the same discipline for agents, and Databricks now ships most of the pieces. This post walks through them with one running example and shows what each piece gives engineers and the business. It's also the first part of The Other 15%, a Rearc series on controlling the share of answers an agent gets wrong.
Our running example is a support agent for a software product. It classifies the question, searches policy documents, looks up the customer's account, and drafts a reply. It passed the demo. Now it's in front of customers.
The usual checks miss agent failures. Agents rarely throw exceptions. The same input can produce different outputs on different days, so exact-match assertions don't work. And each answer comes from hidden decisions about what to retrieve, which tool to call and how to phrase the result, while the logs show only the answer.
The business sees the same problems from another angle. Gartner predicts that over 40% of agentic AI projects will be cancelled by the end of 2027, and names three causes: escalating costs, unclear business value, and inadequate risk controls. Behind each cause sit concrete problems that engineers hit every day, and Databricks has a feature for each one.
| Problem | What engineers see | What the business feels | Databricks feature |
|---|---|---|---|
| Confident wrong answers | HTTP 200, no exception | Complaints, refunds, legal exposure | Scorers and LLM judges |
| Black-box runs | Only the final output | Slow incident response | MLflow Tracing |
| Regressions | A prompt edit passes a few manual checks | Quality drops after a "minor" release | Evaluation datasets, evaluation in CI |
| No definition of "good" | Nothing to assert against | No way to show value | Guidelines judges, versioned scorers |
| Prompt sprawl | Prompts in code, notebooks and chat threads | Nobody knows what runs in production | Prompt Registry |
| Cost creep | Growing token counts, retry loops | Budget overruns | Cost per trace, gateway budgets |
| Policy and data risk | Personal data and prompt injection in requests | Compliance findings | Unity Catalog permissions, service policies |
| Feedback goes nowhere | Feedback isn't linked to the run | The agent never improves | Feedback on traces, judge alignment |
A better prompt fixes none of these. Visibility, repeatable measurement and controls do.
TDD works because it turns "I think it works" into a check that runs on every change. Agent evaluation on Databricks, built on the open-source MLflow 3, has the same shape.
| TDD | Agent evaluation on Databricks |
|---|---|
| Test case | A record in an evaluation dataset: inputs plus expected results |
| Assertion | A code-based scorer, a Python function decorated with @scorer |
| Fuzzy assertion | An LLM judge, a model that grades another model's output |
| Test runner | mlflow.genai.evaluate(), or @mlflow.test inside pytest |
| Debugger | MLflow Tracing |
| Red, then green | A failing production trace becomes a test case, and you fix the agent until it passes |
| CI gate | The suite runs on every change and blocks regressions |
Traces, datasets and prompts live in Unity Catalog (UC), Databricks' governance layer, with the same access control, lineage and SQL access as your tables.
You can't test what you can't see, so start with MLflow Tracing. A trace records one agent run as a tree of spans. Each span is one step, such as a model call, a retrieval or a tool call, with its inputs, outputs, latency and token usage.
MLflow integrates with more than 30 frameworks, so instrumentation is usually one autologging call plus a decorator for your own functions. Autologging is off by default on serverless compute, so call it explicitly.
import mlflow
from mlflow.entities import SpanType

mlflow.set_experiment("/Shared/support-agent")
mlflow.langchain.autolog()  # covers LangChain and LangGraph

@mlflow.trace(span_type=SpanType.RETRIEVER)
def search_policies(query: str):
    ...  # return mlflow.entities.Document objects so retrieval judges can read them
Here's what the trace of the answer looks like once you can see inside it (illustrative):
support_agent                          3.1 s   4,212 tokens
├── classify_intent     CHAT_MODEL     0.4 s   "account_access"
├── search_policies     RETRIEVER      0.3 s   0 documents
├── lookup_account      TOOL           0.2 s   status: active
└── draft_reply         CHAT_MODEL     2.2 s   "...expected under our new login policy"
The model didn't misread a policy. Retrieval found nothing, and the model filled the gap with something plausible. That calls for a different fix: tell the agent to escalate when no policy matches, and add a test that checks it. Without the span tree, you'd be tuning the wrong thing.
Three details matter in practice:
system.ai_gateway.usage table with requester, model, tokens and latency (usage tracking). Spend comes from billing records in system.billing.usage, broken down by service, model, user and tag (cost observability). Budgets send an alert, block a user, or both, once monthly spend crosses a threshold.A trace tells you what happened, not whether it was good. Deciding that is the next step.
In TDD you write the failing test before the fix. For agents, the test case is a record in an evaluation dataset: inputs plus optional expectations, such as an expected answer or facts the answer must contain. Datasets live in Unity Catalog, are versioned, and hold up to 2,000 rows.
The assertion is a scorer. It receives the inputs, outputs, expectations and full trace, and returns pass or fail, a number or a label, ideally with a rationale. Because it sees the trace, it can check how the agent reached the answer.
Build a suite from cheapest to most flexible:
RetrievalGroundedness (is the answer supported by what was retrieved?), Correctness, Safety and ToolCallCorrectness, plus seven judges for whole conversations.make_judge() for domain criteria. A judge whose instructions reference {{ trace }} explores the whole run, for example to check that the right tool got the right parameters.import mlflow
from mlflow.entities import SpanType
from mlflow.genai.scorers import (
Guidelines, RetrievalGroundedness, RetrievalSufficiency, scorer,
)
@scorer
def no_invented_policy(outputs: str, trace) -> bool:
# Deterministic: never cite a policy when retrieval returned nothing
retrieved = trace.search_spans(span_type=SpanType.RETRIEVER)
found_docs = any(span.outputs for span in retrieved)
return found_docs or "policy" not in outputs.lower()
support_rules = Guidelines(
name="support_rules",
guidelines=[
"Never promise a refund, credit or discount.",
"If no policy document supports the answer, offer to escalate to a human.",
],
)
SUITE = [no_invented_policy, support_rules, RetrievalGroundedness(), RetrievalSufficiency()]
results = mlflow.genai.evaluate(
data=mlflow.genai.datasets.get_dataset(name="main.support.eval_cases"),
predict_fn=support_agent,
scorers=SUITE,
)For the business, a scorer is a written, versioned definition of "good." Before it exists, quality is just the opinion of the last person who tried the demo.
The trade-off is that an LLM judge is a model grading a model, with its own error rate. Treat its scores as a strong signal and calibrate the judge against your experts, as covered below in “Close the loop”. Also choose the judge's model with the model argument, and pick a different model family from your agent's, because models tend to favor their own text.
Prompts change more often than any other part of an agent, and they're usually the least governed.
The MLflow Prompt Registry (Beta) treats prompts the way Git treats code. Each prompt is a Unity Catalog object. Each version is an immutable snapshot with a commit message. Aliases such as production point to a version and can move, and the agent loads its prompt by alias instead of hard-coding it.
v = mlflow.genai.register_prompt(
    name="main.support.reply_prompt",
    template="You are a support agent... {{question}} ... {{context}}",
    commit_message="Escalate when no policy document matches",
)

# The agent loads whichever version the alias points to
prompt = mlflow.genai.load_prompt("prompts:/main.support.reply_prompt@production")

# Promotion changes production behavior without a deploy
mlflow.genai.set_prompt_alias("main.support.reply_prompt", alias="production", version=v.version)
That last line is both the feature and the risk. Moving an alias is a fast release and a fast rollback, and it skips your deploy pipeline. Our rule is that an alias moves only after the evaluation suite passes on the new version. Product owners can still propose prompt changes. The suite decides whether they ship.
A dataset with scorers is an objective function, so a machine can search for a better prompt. mlflow.genai.optimize_prompts() (Beta) runs the GEPA algorithm. It evaluates the current prompt, reflects on failures, proposes variants and registers the best one as a new version. Databricks reports that a GEPA-optimized gpt-oss-120b beat a baseline Claude Opus 4.1 by 2.2 points on their extraction benchmark, at 90x lower serving cost. The catch is that it tunes exactly what your scorers measure on exactly your examples. This is how you can end up with an over-fitted evaluation, which is covered below in Tips and Pitfalls.
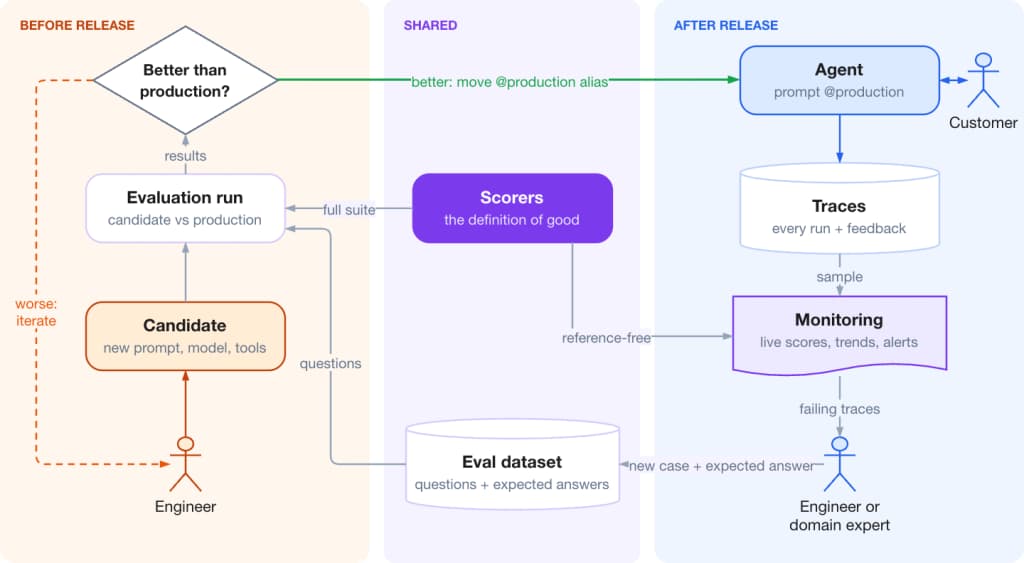
Foundational scorers (like safety and guidelines) run before and after release to keep the core definition of "good" consistent. Adapt the evaluation strategy to what data is available: pre-production relies more on reference-based checks (like Correctness against known datasets with ground truth), whereas post-production emphasizes reference-free operational checks (like live groundedness and relevance) for unlabelled live traffic.
| Pre-production (developers) | Post-production (operations) | |
|---|---|---|
| Question | Is this change better than what's live? | Is what's live still good? |
| Data | A curated, versioned dataset | A sample of production traces |
| Ground truth | Usually available | Rarely available |
| Primary scorer focus | Reference-based judges (Correctness, ToolCallCorrectness) + Foundational (Safety, Guidelines) | Reference-free judges (Groundedness, Relevance) + Foundational (Safety, Guidelines) |
| Runs | On every change to prompt, model, tools or retrieval | Continuously, on a sample |
| Cost control mechanism | Dataset size and repeats per case | Sample rate per scorer |
| Output | Go or no-go | Trends, alerts and new failing cases |
Open-source MLflow 3.14 added @mlflow.test, a pytest plugin that turns an evaluation into an ordinary test. CI runs it like any other test suite.
# conftest.py contains: pytest_plugins = ["mlflow.pytest.plugin"]
import mlflow

@mlflow.test
def test_no_regressions():
    results = mlflow.genai.evaluate(
        data=mlflow.genai.datasets.get_dataset(name="main.support.regression_cases"),
        predict_fn=support_agent,
        scorers=SUITE,
    )
    assert results.passed, results.reason  # every case, every scorer

@mlflow.test
def test_not_worse_than_production():
    VARIANCE_MARGIN = 0.02
    results = mlflow.genai.evaluate(data=CAPABILITY_CASES, predict_fn=support_agent, scorers=SUITE)
    for metric, baseline in PRODUCTION_BASELINE.items():
        allowed_floor = baseline - VARIANCE_MARGIN
        actual_value = results.metrics[metric]
        assert actual_value >= allowed_floor
Practices that pay off:
VARIANCE_MARGIN or run multiple trials to produce more consistent results.Production monitoring (Beta) runs registered scorers against the experiment that receives your production traces. A background job scores a sample and attaches the results to each trace.
from mlflow.genai.scorers import RetrievalGroundedness, Safety, ScorerSamplingConfig

# Critical checks on every trace
Safety().register(name="safety").start(
    sampling_config=ScorerSamplingConfig(sample_rate=1.0)
)
# Expensive judges on a sample
RetrievalGroundedness().register(name="groundedness").start(
    sampling_config=ScorerSamplingConfig(sample_rate=0.1)
)
Practices that pay off:
Correctness.Two gotchas. Custom scorers run remotely, so they must be @scorer functions with imports inside the function body. And monitoring compute is real compute, so attach a serverless budget policy to the experiment to bill the right team.
Evaluation pays off when every production failure becomes a test and every test makes the next release safer. Databricks describes this as a quality loop:
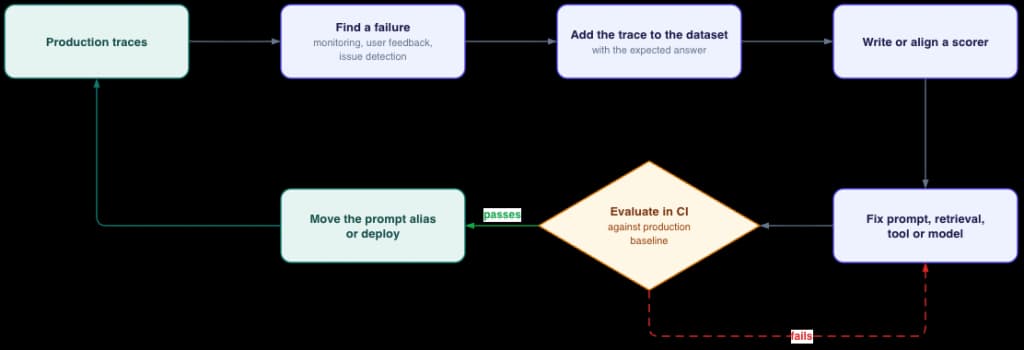
The shortest path from failure to test is in the trace UI. Open the bad trace, add an expectation with the correct answer, and add the trace to the evaluation dataset. That's the agent version of "write a failing test that reproduces the bug," and your dataset grows from real failures instead of imagined ones.
Human judgment feeds the same loop. Developers annotate traces while they build. Domain experts label traces in review queues (Beta). End users click thumbs-up or thumbs-down, and mlflow.log_feedback() attaches the rating to the trace it came from.
Experts and generic judges will disagree on domain nuance. With judge alignment, experts correct the judge's verdicts on real traces, and judge.align() builds a judge that agrees with them more often. In a Databricks case study, about 50 expert labels cut judge error by 74 to 89% on the three dimensions where the judge did worst. The docs ask for at least 10 labeled traces, ideally 50 to 100, with at least 30% negative examples.
The loop fixes more than prompts. Retrieval judges separate "the context was wrong" from "the model misused good context." Tool-call judges expose unclear tool descriptions and redundant calls. And a switch to a cheaper model becomes a measured decision.
For the business, this is where AI quality stops being an opinion and becomes a trend line. Each pass through the loop produces a reportable change: the failure, the fix, and the scores that moved.
Evaluation almost never breaks loudly. Nothing throws an error. It just slowly drifts until your scores look amazing and mean nothing.
Your best overfitting detector is production monitoring. Offline scores predict how the agent will do. Reference-free scores on live traffic show how it did.
Evaluation tells you whether the agent is good. It can't stop a bad request in flight, cap a runaway loop, or keep a credit card number out of a model provider's logs. That's the job of Unity Gateway, formerly Unity AI Gateway. It applies the same controls to Databricks-hosted models, external providers and MCP servers (Model Context Protocol, the standard way agents call tools).
| Control | What it does | Watch out for |
|---|---|---|
| Access | UC EXECUTE grants per model or MCP service. MCP tool filtering exposes only the tools you select | All users can execute system.ai models by default |
| Rate limits | Queries and tokens per minute, per service, user, group or service principal. HTTP 429 when exceeded | Usage is counted after the response, so short bursts can overshoot |
| Budgets | Monthly spend thresholds, shared or per user, that alert or block | Enforcement is approximate and excludes provisioned throughput; check system.billing.usage for the real spend metrics. |
| Service policies (Beta) | Allow, deny or ask for approval based on content. Built-ins cover unsafe content, jailbreaks, hallucinations and sensitive data | Policies fail closed, so any evaluation error means deny |
| Routing | Traffic split across up to 5 destinations, with ordered fallbacks on 429 or 5xx | Fallback destinations can't be split |
| Usage and payloads | system.ai_gateway.usage, inference tables, unified trace table (Beta) | Payloads hold customer data, so set access and retention first |
Two of these connect directly to evaluation. A policy deny returns HTTP 200 with a databricks_service_policy object, so your agent and scorers must recognize it, or monitoring will grade a block as a bad answer. And most built-in guardrails are LLM judges with false positives. Start new policies in Log mode, test them against real attacks and look-alike legitimate requests, and only then enforce.
On the Unity Gateway CLI episode of Streams, Lakes, and Deltas: Not a Nature Podcast, Riley Nastase set the test that runs through this series. An agent that's right 85% of the time still needs a control for the other 15%. Evaluation shows you where that 15% is, and the gateway limits what the agent can reach and spend while you fix it. Next in The Other 15%: routing, so your most expensive models only handle the work that needs them
Agents fail quietly, so confidence in them has to come from evidence. Databricks covers the whole path: MLflow Tracing shows what the agent did, scorers and LLM judges define what "good" means, evaluation datasets in CI catch regressions before release, the Prompt Registry tracks what changed, monitoring keeps scoring live traffic, and Unity Gateway controls access, spend and content on every request.
Together they answer Gartner's three reasons projects get cancelled: costs you can see and cap, value you can show as scores over time, and risks you've tested. That's what TDD gave regular code: you move faster because you find out sooner when something breaks.
Read more about the latest and greatest work Rearc has been up to.
Example Blog Article
AI agents fail quietly with fluent, wrong answers. Learn how to apply test-driven development to agents on Databricks using MLflow tracing, scorers, evaluation datasets, the Prompt Registry, production monitoring and Unity Gateway.

A practical approach to Databricks CI/CD for regulated teams: consistent deployments with Declarative Automation Bundles, isolated environments, human approvals, and a release trail that holds up to a SOX audit.
Managing pipelines with a metadata-driven framework
Tell us more about your custom needs.
We’ll get back to you, really fast
We will evaluate your query and respond within 2 business days.
Kick-off meeting
We will schedule a quick meeting to further understand your use case and start working toward a solution together!